I’ve recently had the unfortunate task to diagnose and monitor memory and GC related events for our asp.net api running on .net 4.7.2 in Azure App Services (Azure Web app). Information and examples on how to do this is hard to come by and perhaps not relevant due to the difference in azure appservices environment, so I thought I’d summarize my experience in Jan 2020. Note: I’m not sure if this post applies to .net core.
What Performance Counters are interesting?
I don’t know about you, but this is the first time I’m using Performance Counters although I’ve “heard about them” before. So what performance counters exist and what do they tell us? I found this documentation very helpful in listing and understanding what they mean.
When diagnosing memory, I found these blog posts helpful:
- Optimizing garbage collection in a high load .NET service (2019)
- The Dangers of the Large Object Heap (2009)
- No More Memory Fragmentation on the .NET Large Object Heap (2013)
- A .NET Garbage Collection Mystery
Azure AppServices does not expose all Performance Counters
Because Azure AppServices are running in a sandbox environment, we are not allowed to get performance counters as usual. However, a subset (April, 2018) is exposed via dynamic environment variables.
The variables are:
WEBSITE_COUNTERS_ASPNET- Returns a JSON object containing the ASP.NET perf counters.WEBSITE_COUNTERS_APP- Returns a JSON object containing sandbox counters.WEBSITE_COUNTERS_CLR- Returns a JSON object containing CLR counters.WEBSITE_COUNTERS_ALL- Returns a JSON object containing the combination of the other three.
Since the source was last updated in April 2018, I visited my site in Kudo (https://example.scm.azurewebsites.net/DebugConsole/?shell=powershell) and executed $env:WEBSITE_COUNTERS_ALL to see what counters are available in 2020.
Performance counters in ASP.NET Azure App Services (2020):
{
    "aspNet": {
        "applicationRestarts": 0,
        "applicationsRunning": 0,
        "requestsDisconnected": 0,
        "requestExecutionTime": 0,
        "requestsRejected": 0,
        "requestsQueued": 0,
        "wpsRunning": 0,
        "wpsRestarts": 0,
        "requestWaitTime": 0,
        "requestsCurrent": 0,
        "globalAuditSuccess": 0,
        "globalAuditFail": 0,
        "globalEventsError": 0,
        "globalEventsHttpReqError": 0,
        "globalEventsHttpInfraError": 0,
        "requestsInNativeQueue": 0,
        "anonymousRequests": 0,
        "totalCacheEntries": 0,
        "totalCacheTurnoverRate": 0,
        "totalCacheHits": 0,
        "totalCacheMisses": 0,
        "totalCacheRatioBase": 0,
        "apiCacheEntries": 0,
        "apiCacheTurnoverRate": 0,
        "apiCacheHits": 0,
        "apiCacheMisses": 0,
        "apiCacheRatioBase": 0,
        "outputCacheEntries": 0,
        "outputCacheTurnoverRate": 0,
        "outputCacheHits": 0,
        "outputCacheMisses": 0,
        "outputCacheRatioBase": 0,
        "compilations": 0,
        "debuggingRequests": 0,
        "errorsPreProcessing": 0,
        "errorsCompiling": 0,
        "errorsDuringRequest": 0,
        "errorsUnhandled": 0,
        "errorsTotal": 0,
        "pipelines": 0,
        "requestBytesIn": 0,
        "requestBytesOut": 0,
        "requestsExecuting": 0,
        "requestsFailed": 0,
        "requestsNotFound": 0,
        "requestsNotAuthorized": 0,
        "requestsInApplicationQueue": 0,
        "requestsTimedOut": 0,
        "requestsSucceded": 0,
        "requestsTotal": 0,
        "sessionsActive": 0,
        "sessionsAbandoned": 0,
        "sessionsTimedOut": 0,
        "sessionsTotal": 0,
        "transactionsAborted": 0,
        "transactionsCommitted": 0,
        "transactionsPending": 0,
        "transactionsTotal": 0,
        "sessionStateServerConnections": 0,
        "sessionSqlServerConnections": 0,
        "eventsTotal": 0,
        "eventsApp": 0,
        "eventsError": 0,
        "eventsHttpReqError": 0,
        "eventsHttpInfraError": 0,
        "eventsWebReq": 0,
        "auditSuccess": 0,
        "auditFail": 0,
        "memberSuccess": 0,
        "memberFail": 0,
        "formsAuthSuccess": 0,
        "formsAuthFail": 0,
        "viewstateMacFail": 0,
        "appRequestExecTime": 0,
        "appRequestDisconnected": 0,
        "appRequestsRejected": 0,
        "appRequestWaitTime": 0,
        "cachePercentMachMemLimitUsed": 0,
        "cachePercentMachMemLimitUsedBase": 0,
        "cachePercentProcMemLimitUsed": 0,
        "cachePercentProcMemLimitUsedBase": 0,
        "cacheTotalTrims": 0,
        "cacheApiTrims": 0,
        "cacheOutputTrims": 0,
        "appCpuUsed": 0,
        "appCpuUsedBase": 0,
        "appMemoryUsed": 0,
        "requestBytesInWebsockets": 0,
        "requestBytesOutWebsockets": 0,
        "requestsExecutingWebsockets": 0,
        "requestsFailedWebsockets": 0,
        "requestsSucceededWebsockets": 0,
        "requestsTotalWebsockets": 0
    },
    "app": {
        "userTime": 81718750,
        "kernelTime": 74531250,
        "pageFaults": 447720,
        "processes": 6,
        "processLimit": 0,
        "threads": 91,
        "threadLimit": 0,
        "connections": 1,
        "connectionLimit": 0,
        "sections": 0,
        "sectionLimit": 0,
        "namedPipes": 6,
        "namedPipeLimit": 128,
        "readIoOperations": 3325,
        "writeIoOperations": 894,
        "otherIoOperations": 28613,
        "readIoBytes": 163512305,
        "writeIoBytes": 70659170,
        "otherIoBytes": 2008223,
        "privateBytes": 2093711360,
        "handles": 6769,
        "contextSwitches": 816796,
        "remoteOpens": 3427,
        "remoteWrites": 202,
        "remoteWriteKBs": 10058,
        "availMemoryBytes": 11285364736,
        "remoteDirMonitors": 4,
        "remoteDirMonitorLimit": 0,
        "activeConnections": 0,
        "activeConnectionLimit": 0
    },
    "clr": {
        "bytesInAllHeaps": 0,
        "gcHandles": 654,
        "gen0Collections": 0,
        "gen1Collections": 0,
        "gen2Collections": 0,
        "inducedGC": 0,
        "pinnedObjects": 0,
        "committedBytes": 0,
        "reservedBytes": 0,
        "timeInGC": 0,
        "timeInGCBase": 0,
        "allocatedBytes": 0,
        "gen0HeapSize": 0,
        "gen1HeapSize": 0,
        "gen2HeapSize": 0,
        "largeObjectHeapSize": 0,
        "currentAssemblies": 19,
        "currentClassesLoaded": 400,
        "exceptionsThrown": 14,
        "appDomains": 1,
        "appDomainsUnloaded": 0
    },
    "adonet": []
}
Reporting to Application Insights
You could write some .NET to fetch these variables and log them as you see fit. But since I already use Application Insights for telemtetry I wanted to make sure ApplicationInsights log the counters I’m interested in.
To do this, I modified my ApplicationInsights.config file.
<?xml version="1.0" encoding="utf-8"?>
  <ApplicationInsights xmlns="http://schemas.microsoft.com/ApplicationInsights/2013/Settings">
    <!-- ...omitted for brevity -->
    <TelemetryModules>
      <!-- ...omitted for brevity -->
       <Add Type="Microsoft.ApplicationInsights.Extensibility.PerfCounterCollector.PerformanceCollectorModule, Microsoft.AI.PerfCounterCollector">
      <!--
      Use the following syntax here to collect additional performance counters:

      <Counters>
        <Add PerformanceCounter="\Process(??APP_WIN32_PROC??)\Handle Count" ReportAs="Process handle count" />
        ...
      </Counters>

      PerformanceCounter must be either \CategoryName(InstanceName)\CounterName or \CategoryName\CounterName

      NOTE: performance counters configuration will be lost upon NuGet upgrade.

      The following placeholders are supported as InstanceName:
        ??APP_WIN32_PROC?? - instance name of the application process  for Win32 counters.
        ??APP_W3SVC_PROC?? - instance name of the application IIS worker process for IIS/ASP.NET counters.
        ??APP_CLR_PROC?? - instance name of the application CLR process for .NET counters.
      -->
      <Counters>
        <Add PerformanceCounter="\.NET CLR Memory(??APP_CLR_PROC??)\% Time in GC" ReportAs="% Time In GC" />
        <Add PerformanceCounter="\.NET CLR Memory(??APP_CLR_PROC??)\# Gen 0 Collections" ReportAs="# Gen 0 Collections" />
        <Add PerformanceCounter="\.NET CLR Memory(??APP_CLR_PROC??)\# Gen 1 Collections" ReportAs="# Gen 1 Collections" />
        <Add PerformanceCounter="\.NET CLR Memory(??APP_CLR_PROC??)\# Gen 2 Collections" ReportAs="# Gen 2 Collections" />
        <Add PerformanceCounter="\.NET CLR Memory(??APP_CLR_PROC??)\Gen 0 heap size" ReportAs="Gen 0 Heapsize" />
        <Add PerformanceCounter="\.NET CLR Memory(??APP_CLR_PROC??)\Gen 1 heap size" ReportAs="Gen 1 Heapsize" />
        <Add PerformanceCounter="\.NET CLR Memory(??APP_CLR_PROC??)\Gen 2 heap size" ReportAs="Gen 2 Heapsize" />
        <Add PerformanceCounter="\.NET CLR Memory(??APP_CLR_PROC??)\Large Object Heap size" ReportAs="Large Object Heap Size" />
        <Add PerformanceCounter="\.NET CLR Memory(??APP_CLR_PROC??)\# Induced GC" ReportAs="# Induced GC" />
        <Add PerformanceCounter="\.NET CLR Memory(??APP_CLR_PROC??)\Allocated Bytes/ sec" ReportAs="Allocated Bytes/ Sec" />


      </Counters>
    </Add>
    <!-- ...omitted for brevity -->
With this config I could publish the webapp to azure. As you can see, I’ve added a number of Performance Counters without referencing the environment variables I mentioned earlier. That’s because Application Insights has support to automatically translate these counter names and get the data from the the environment variables.
But what counters does Application Insights support and what are they named? Which environment variables is used for what counter? To find out about this I had to dig through the source code of the SDK to find the CounterFactory.cs class that lists all performance counters supported in asp.net
Querying and visualizing the Performance counters
To check if the metrics are reported correctly I turn to my Application Insights Logs (Analytics) and ran the following query to see which counters were being reported:
performanceCounters
| distinct name, counter
Below are some queries I find useful.
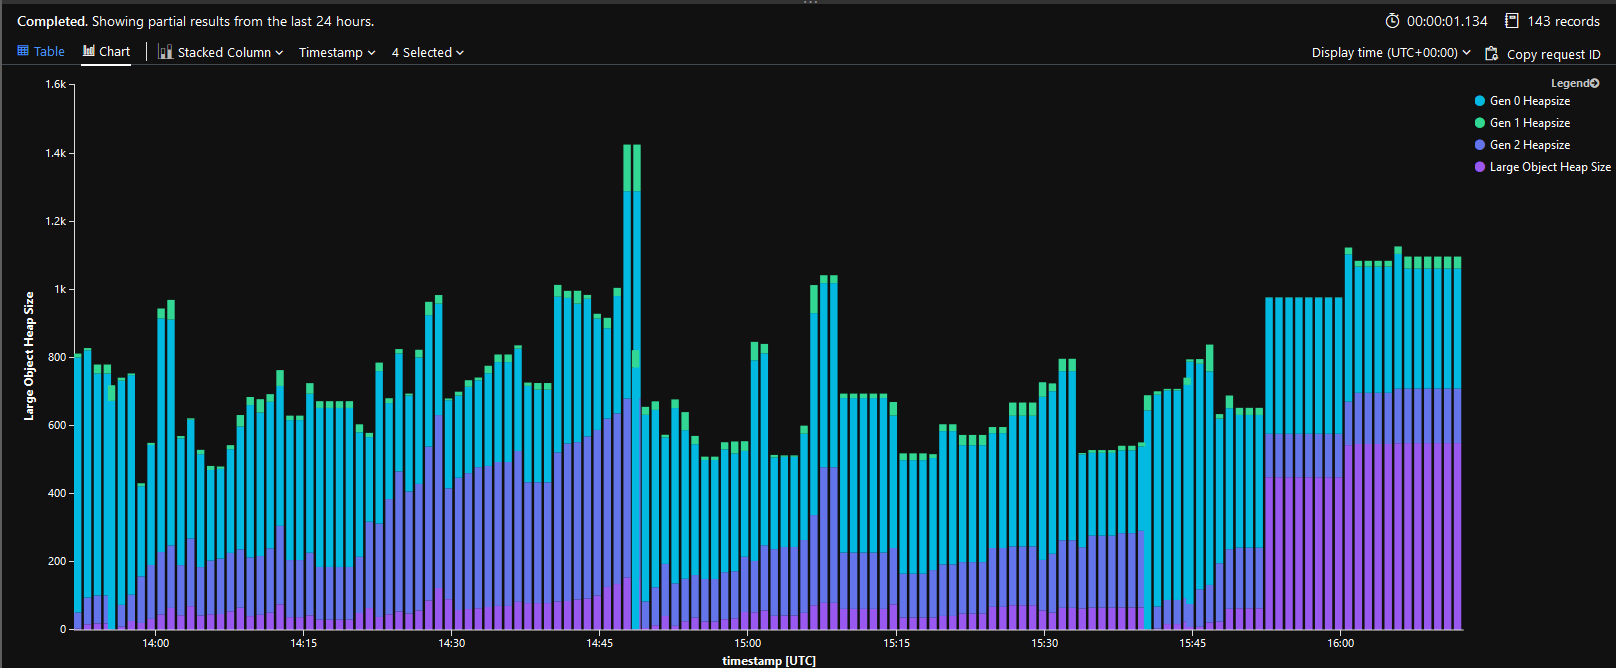
View Heapsizes over time
performanceCounters
| where name contains "Gen 2 Heapsize" or name contains "Gen 1 Heapsize" or name contains "Gen 0 Heapsize" or name contains "Large Object Heap Size"
| project timestamp, name, value = value / 1000000, cloud_RoleInstance, cloud_RoleName
| evaluate pivot(name, avg(value), timestamp)
| render barchart
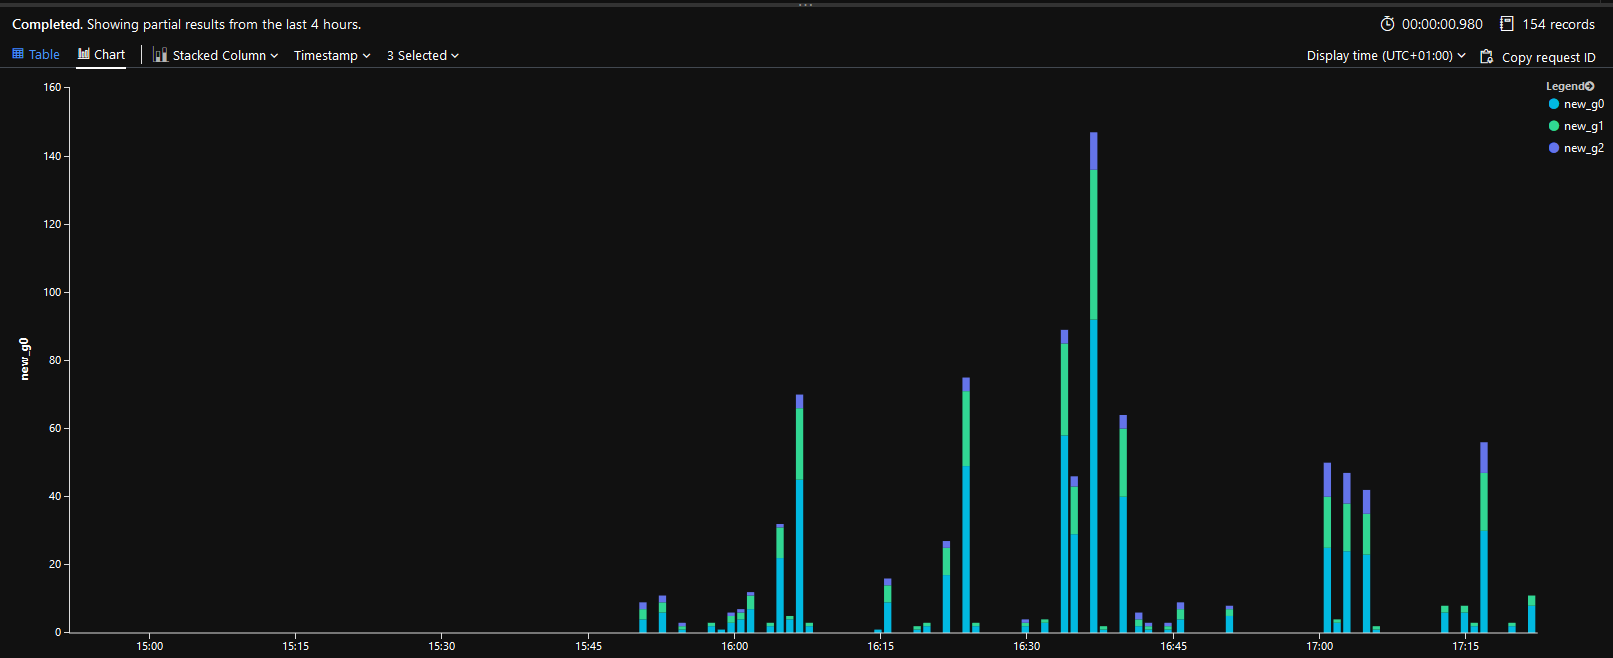
View new Collections over time
The Gen Collection counter is an ever incrementing number. To visualize when and how many collections are being actually made, you can use the following query that compares a value to the previous value.
performanceCounters
| where name contains "Collections"
| order by timestamp asc
| evaluate pivot(name, avg(value), timestamp, cloud_RoleName, cloud_RoleInstance)
| extend g0 = ["# Gen 0 Collections"]
| extend g1 = ["# Gen 1 Collections"]
| extend g2 = ["# Gen 2 Collections"]
| serialize
| extend new_g0 = max_of(g0 - prev(g0,1,0), real(0))
| extend new_g1 = max_of(g1 - prev(g1,1,0), real(0))
| extend new_g2 = max_of(g2 - prev(g2,1,0), real(0))
| project timestamp, new_g0, new_g1, new_g2
| render barchart
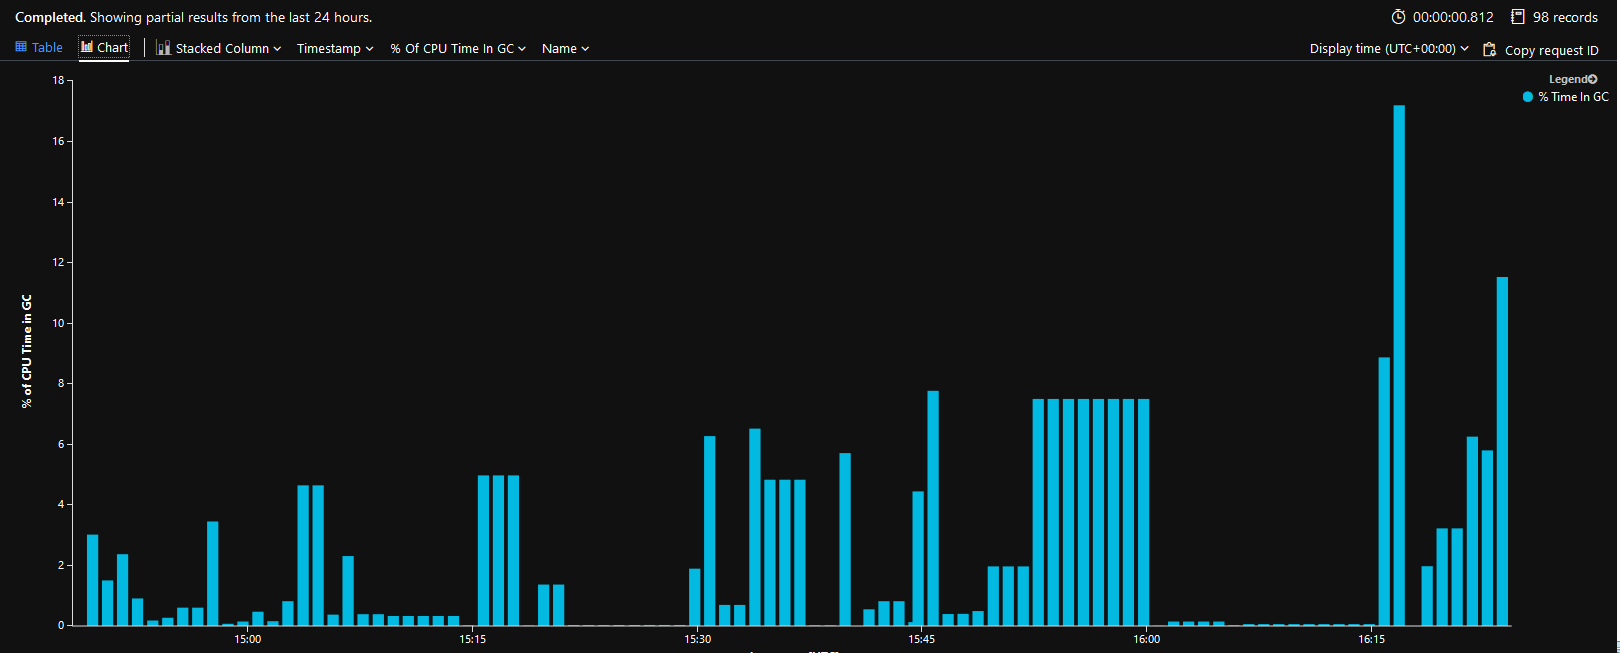
View % CPU Time in GC over time
performanceCounters
| where name contains "% Time in GC"
| project timestamp, name, value, cloud_RoleInstance, cloud_RoleName
Final notes
I hope this helped you if you are in the same position I was in. If you think I’ve gotten anything backwards, please tell me so on twitter @andersaberg. Feedback is always welcome.